
Ever seen a map that changes shading? Move your cursor or tap anywhere in the map below to change the sun's position!
We have a 16 bit grayscale DEM height map:
...uhh, okay yeah that's super exciting, let's level that a little so you can actually see what it looks like:
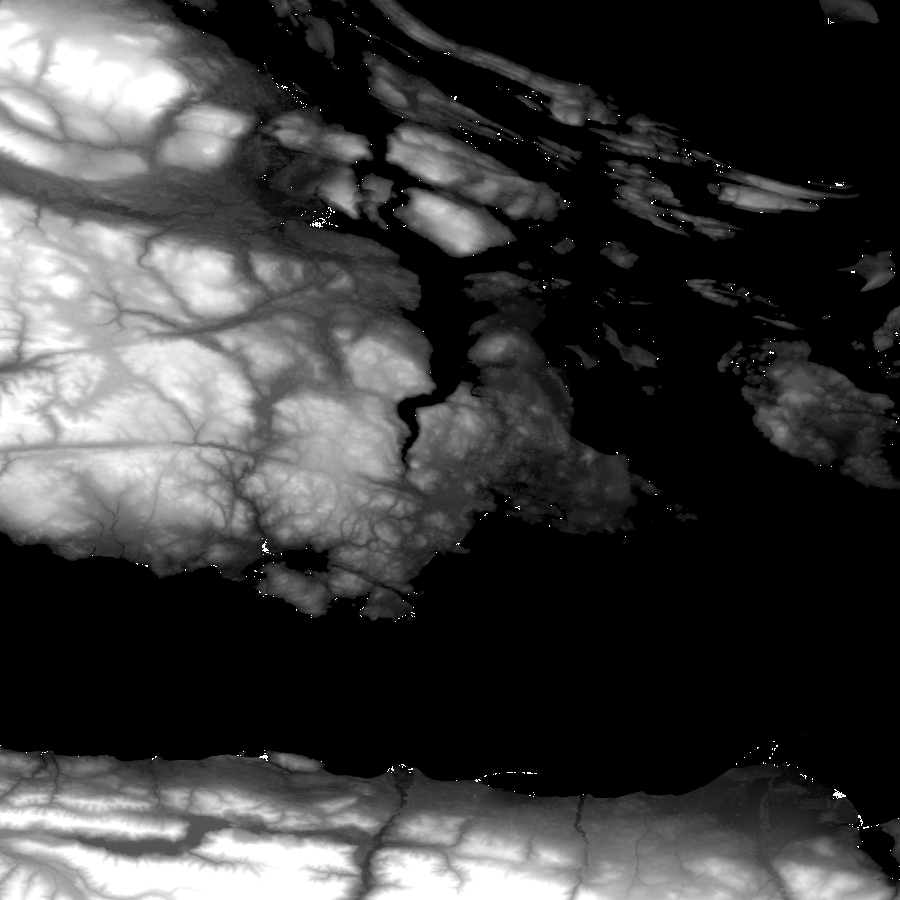
Every pixel in this image isn't a "colour" so much as a height value, where white pixels are "pretty high up!" and black pixels are effectively sea level (or, technically maybe even a little lower than that!)
In order to turn this (frankly) not very useful information into a good looking 2D map, we can convert the height map into something that (to a computer at least) looks like a 3D surface, so thast we can then shine some light on it and get something that looks... you know... like actual terrain.
The standard way to do this is to compute the
surface normal
for each pixel, i.e. the vector that tells us the 3D angle of the surface
at that pixel, by looking at each pixel's four direct neighbours. This is
surprisingly simple: we just create a vector
{x: a-b, y: c-d, z: 2} where "a" and "b" are the heights for
the pixels at (x-1,y) and (x+1,y) respectively, and "c" and "d" are the
heights for the pixels at (x,y-1) and (x,y+1), respectively.
If we then normalize that vector (i.e. scale it such that it has a total length of 1) and render it as an RGB vector (so, pretending that "x" represents the pixel's red value, "y" the green value, and "z" the blue value) we get this:

We can then compute how much light would get reflected "up" into the screen, given the sun at some specific position: we can use the standard vector reflection approach to have a "ray of sunlight" bounce off of our pixel's surface, giving us a neatly illuminated terrain view:

So that covers the general shading, but there's not a lot of colour here yet. Which makes for a pretty bad map.
We want a nice map, so let's make a coloring book: we can take our height map and, using the Marching Squares algorithm, find all regions that have the same general elevation so that we get lines that separate different altitudes. For example, if we picked a 100 foot spacing, we can get one line that separates "everything between 100 feet and 200 feet", another for "everything between 200 feet and 300 feet", and so on.
We can run this with as many "bands" as we like, to get something that looks like this:

And we can can then fill in the areas between these "isolines" using some false color designed to look appropriate to the elevation we're coloring in:
Which gives us something that looks like this:

And to be honest, this already kinda looks like a pretty nice 2D map. But, we can do even better by mixing in our terrain shading...
If we make the iso lines themslves less pronounced (say, 80% transparent) and we overlay our "shaded" black and white image using the color-burn method, (after blurring it a little) to generate the general, subtle shading, we get this:

That might look a little fuzzy, but we're not quite done yet.
If we add the shaded height map as a 70% transparent overlay to the previous view (without blurring this time), we end up highlighting and "crisping up" all the landscape features, and end up with a kick-ass looking 2D map!
Although we do need to make sure that we don't shade anything that's perfectly flat, so we do a quick calculation of what value corresponds with "the sun, reflected on a perfectly flat surface" and then we filter out anything with that exact value, to get:

And done! That's how you turn a height map image into a pretty sweet 2D map!
... but as a final touch, of course, we can bring it back to the animated graphics all the way at the top: we can tie the sun's vector to the position of the cursor on the image, so that we can change the way the terrain gets lit simply by moving the cursor around!
— Pomax